 Catalogue PIGMA
Sea temperature
Type of resources
Available actions
Topics
Keywords
Contact for the resource
Provided by
Formats
Representation types
Update frequencies
status
Scale
Resolution
-

This dataset provide a times series of daily multi-sensor composite fields of Sea Surface Temperature (SST) foundation at high resolution (HR) on a 0.10 x 0.10 degree grid (approximately 10 x 10 km) for the Global Ocean, every 24 hours. Whereas along swath observation data essentially represent the skin or sub-skin SST, the L3S SST product is defined to represent the SST foundation (SSTfnd). SSTfnd is defined within GHRSST as the temperature at the base of the diurnal thermocline. It is so named because it represents the foundation temperature on which the diurnal thermocline develops during the day. SSTfnd changes only gradually along with the upper layer of the ocean, and by definition it is independent of skin SST fluctuations due to wind- and radiation-dependent diurnal stratification or skin layer response. It is therefore updated at intervals of 24 hrs. SSTfnd corresponds to the temperature of the upper mixed layer which is the part of the ocean represented by the top-most layer of grid cells in most numerical ocean models. It is never observed directly by satellites, but it comes closest to being detected by infrared and microwave radiometers during the night, when the previous day's diurnal stratification can be assumed to have decayed. The processing combines the observations of multiple polar orbiting and geostationary satellites, embedding infrared of microwave radiometers. All these sources are intercalibrated with each other before merging. A ranking procedure is used to select the best sensor observation for each grid point. This dataset is generated daily within a 24 delay and is therefore suitable for assimilation into operational models. It is produced in the frame of Copernicus Marine Service and the data available through various tools and protocols with a simple user registration from this service (product identifier: SST_GLO_SST_L3S_NRT_OBSERVATIONS_010_010) at: https://data.marine.copernicus.eu/product/SST_GLO_SST_L3S_NRT_OBSERVATIONS_010_010
-
Measurements by drifting surface buoys. This system is a drifting mooring consisting of a surface buoy fastened to a floating anchor by a cable (trip line, buoy rope). It has to monitor as precisely as possible the water volume in which the floating anchor is immersed. The surface buoys are traced by Argos satellites.
-
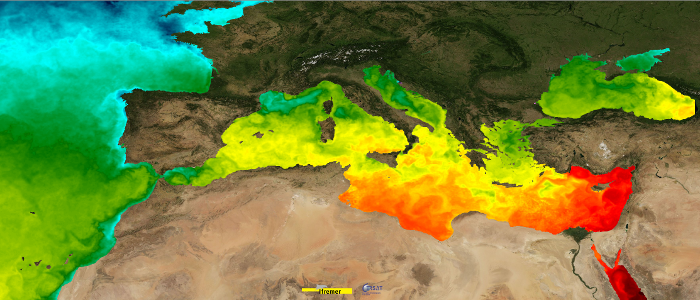
This dataset provide a times series of daily mean fields of Sea Surface Temperature (SST) foundation at ultra-high resolution (UHR) on a 0.02 x 0.02 degree grid (approximately 2 x 2 km) for the Mediterranean Sea, every 24 hours. An Optimal interpolation (OI) technique is used to combine coincident swath measures of SST from different types satellite sensors and to fill gaps where no observations are available or obstructed by clouds. This multi-sensor compositing and interpolation process categorizes this dataset as a Level 4 product. Whereas along swath observation data essentially represent the skin or sub-skin SST, the L4 SST product is defined to represent the SST foundation (SSTfnd). SSTfnd is defined within GHRSST-PP as the temperature at the base of the diurnal thermocline. It is so named because it represents the foundation temperature on which the diurnal thermocline develops during the day. SSTfnd changes only gradually along with the upper layer of the ocean, and by definition it is independent of skin SST fluctuations due to wind- and radiation-dependent diurnal stratification or skin layer response. It is therefore updated at intervals of 24 hrs. SSTfnd corresponds to the temperature of the upper mixed layer which is the part of the ocean represented by the top-most layer of grid cells in most numerical ocean models. It is never observed directly by satellites, but it comes closest to being detected by infrared and microwave radiometers during the night, when the previous day's diurnal stratification can be assumed to have decayed. The processing combines the observations of multiple polar orbiting and geostationary satellites, embedding infrared of microwave radiometers. All these sources are intercalibrated with eachother before merging. The processing is the same as for the Atlantic Near Real Time (NRT) L4 dataset available on Copernicus Marine Service [SST_ATL_SST_L4_NRT_OBSERVATIONS_010_025 dataset] and users can refer to the user manual and quality documents available there for more details. This dataset was developed in the frame of European Space Agency (ESA)'s Medspiration project.
-
The annually binned Sea Surface Salinity, Temperature and Density data set covers a large part of the North Atlantic subpolar gyre. It is based on T and S near-surface data collected since December 1895 to August 2018 from all data sources, including Voluntary Observing Ships subsequently validated. This annual product presents deviations from a climatological seasonal cycle and has furthermore been smoothed in time with a 1/4, 1/2, 1/4 running-mean filter. Density time series are estimated from those annual time series, considering winter (D-J-F) climatology. Uncertainty estimates due to sampling are also provided. Data for December 2017-August 2018 are also reported as 2018, but are temporary and should not be used without further check. Long gaps have been filled by linear interpolation, and are attributed largest error.
-
The annually binned Sea Surface Salinity data set covers a large part of the Atlantic Ocean (75°W-10°E, 20°S-70°N). It is based on salinity near-surface data collected since December 1895 to 2016 from all data sources, including Voluntary Observing Ships subsequently validated. This annual product presents Atlantic SSS 32 grid box anomaly and error time-series (for boxes 1 to 26, year 2016 not smoothed 1-2-1), as well as Atlantic SSS grid box coordinates and March-May mean climatology. The SSS binned time series are an update from the 1896-2013 time series (Friedman et al., 2017).
-
The gridded Sea Surface Salinity (SSS) data set covers the region between 95°W – 20°E and 50°N – 30°S in the Atlantic Ocean. It is based on available data collected from 1970 to 2016 mostly from Voluntary Observing Ships, PIRATA moorings and Argo profilers, and subsequently validated. This monthly SSS product is gridded using an objective mapping at the spatial resolution 1° x 1°. It is distributed with its associated error fields. It is an update of the SSS product presented in Reverdin et al (2007).
-
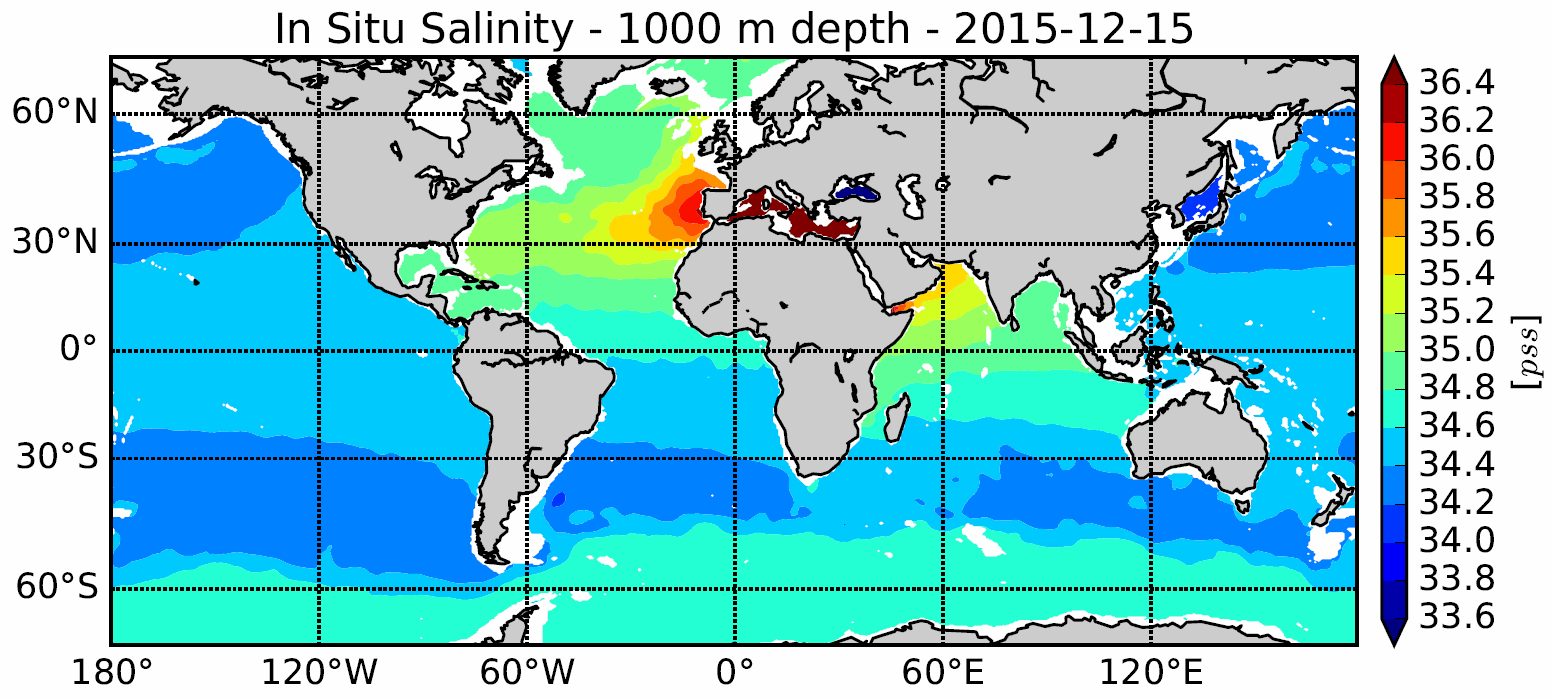
The In Situ Analysis System (ISAS) has been developed to produce temperature and salinity fields that preserve as far as possible the time and space sampling capabilities of the Argo float network. Since the first global analysis in 2009, the system has been extended to take into account all types of vertical profiles and time series, as well as new parameters such as dissolved oxygen produced by BGC Argo. ISAS gridded fields are based entirely on in situ measurements. The system aims to monitor the evolution of ocean properties as a function of time for climatological studies, and to enable easy calculation of climate indices. Delayed-time processing of the 2002-2020 dataset has been carried out using ISAS-V8 and the updating of a priori statistics. Note that ISAS-V8 has been implemented as an operational analysis tool at the Coriolis data center since June 2020.
-
TSG-QC is a tool for interactive analysis and validation of sea surface temperature and salinity data acquired from a Thermosalinograph (TSG) installed on research or commercial ships. It has been developed under Matlab. It allows: • Visualization of TSG variables: Temperature, salinity and ship speed • Interactive comparison with climatological values (WOA and ISAS) • Automatic quality control using selected threshold criteria • Data validation and adjustment with external measurements (water samples, collocated Argo data, CTD, ...) • Quantitative estimation of sensor drift. The software can deal with different input data formats: ASCII, Labview, Seabird, GOSUD NetCDF... The use of TSG-QC from sources requires a valid Matlab license. A compiled version is available free of charge for users who do not have a Matlab license.
-
The binned Sea Surface Salinity, Temperature and Density data set covers regularly sampled ship-of-opportunity lines. It is based on data collected from 1993 to 2018 from Voluntary Observing Ships subsequently validated. This monthly product is binned with monthly total values deviations and then deviations from climatology in each bin, with additional 1-2-1 time filter applied on the averages. Along B-AX01, some gaps were filled with additional data located one degree north or south of the grid boxes.
-
Sea Surface Salinity (SSS) is an essential climate variable that requires long term in situ observation. The French SSS Observation Service (SSS-OS) manages a network of Voluntary Observing Ships equipped with thermosalinographs (TSG) since 2002. The network is global though more concentrated in the tropical Pacific and North Atlantic oceanic basins. The acquisition system is autonomous with real time transmission and is regularly serviced at harbor calls. The high resolution data retrieved from the acquisition system during ship calls is processed through a dedicated software (freely available) for attribution of data quality flags by visual inspection, and correction of TSG time series by comparison with climatology, onboard daily water samples and collocated Argo data. Details can be found in the reference below. The validated delayed time data collected from TSG, together with some bucket samples mostly collected before 2002, are made available for educational and research purposes through an interactive web interface.